More concept, ideas and investment strategies with Jitta
How is Loss Chance Beneficial?
From question, “How is Loss Chance beneficial in selecting your investments?” I have written this article to further explain the application of Loss Chance.
Mainly, Loss Chance is the value that helps predict the chances of making a loss from the 100 stocks that we buy and hold for 1 year, if we buy a total of 100 stocks with particular Jitta Scores with particular values above or below the Jitta Line… how many stocks would make a loss.
For example, when we see a stock with a Jitta Score of 7.5, a price 5% below the Jitta Line, and a Loss Chance value of 35%, it means that if we buy 100 stocks with these exact values, and hold them for 1 year, there will be 35 stocks that are losses, and 65 that are profitable.
Just as Peter Lynch said
in stock investment, we only need to be correct 60% of the time to get successful returns from the stock market. Which is why when you invest, try to select stocks that have Loss Chance values of lower than 40%, because if you invest in each stock equally, the chances of profiting in the long-run will be quite high.
The reason Jitta has created the Loss Chance value is because we know that businesses go through changes constantly, which means their business value changes all the time. A good business today may not be good in six months time. This is why the Loss Chance value is created to remind investors that nothing is 100% perfect. All investments carry risks. Even a good company carries risks. Which is why we should diversify our investment (at least 5-10 stocks), so as to not put all our eggs in one basket.
The Loss Chance value is also helps being a proof that for good companies with reasonable prices, the chances of making losses from them are lower than 50%. Therefore, by investing only in companies such as these and sufficiently spreading your investments properly, you can expect a decent return from your investments.
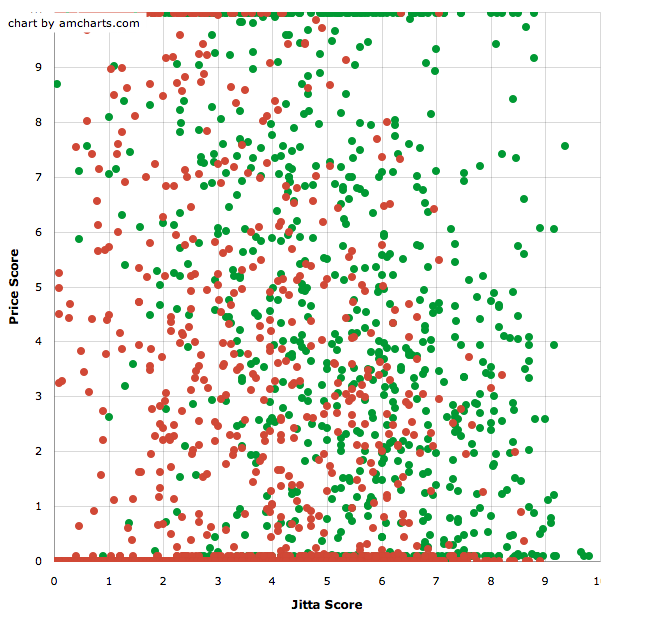
As for the method of calculating Loss Chance, please refer to the image in this article. This is the first proof that the Jitta Score and Jitta Line truly works. If we plot all the stocks in the US in a graph based on their company quality (X-axis) and reasonable value (Y-axis), after investing in quality companies at prices lower than their reasonable value, we will have a higher chance of gaining than losing.
This has proven to be true. Each dot is a stock with Jitta Score and Above/ Below Jitta Line at the present. The green dots are profitable stocks, while the red dots are stocks that are making a loss. After holding these stocks for 5 years, we can see that the group of stocks on the top right (Wonderful Company at a fair price) are stocks that profitable (calculated only by capital gain), and when we slowly move down to the bottom left, we will see more stocks that are making losses.
After knowing that the Jitta Score and Jitta Line is applicable in the real investment arena, we wondered how much chance these stocks, with similar Jitta Scores and Above/below Jitta Line (before we used to call them Matrix, such as Matrix 7,7, for example), will have in making profits and losses. So we calculated back and collected the statistical data of the stocks in each cell, and we concluded that on average, if we invested in 100 stocks within the same Matrix for 1 year, how many stocks would be losses and how many would be profitable. This is became our method in calculating Loss Chance.
Every year, Jitta collects these matrix data (with every passing year, Jitta will have a wider sample of the stocks in each Matrix), hence producing an increasingly accurate average value every year.
For those who haven’t read about the mechanisms behind this image, you may do so at this link
In the past, there is also the Estimate Gain value, which tells you the percentage of making profit when you buy stocks in each Matrix and hold them for 1 year. This value has been replaced by the Jitta Ranking, which is easier to understand than the Matrix, and also gives better return because we are able to take other factors into the calculation of the Ranking, whereas the Matrix is only derived from the Jitta Score and Jitta Line.
Currently, the Estimate Gain value is not displayed on Jitta. Only Loss Chance is shown, so that investors can assess the probability of their error in investment, which is not shown through Jitta Ranking. This is why the Loss Chance value is beneficial to investors using Jitta.