More concept, ideas and investment strategies with Jitta
Tutorial: Stock Summary
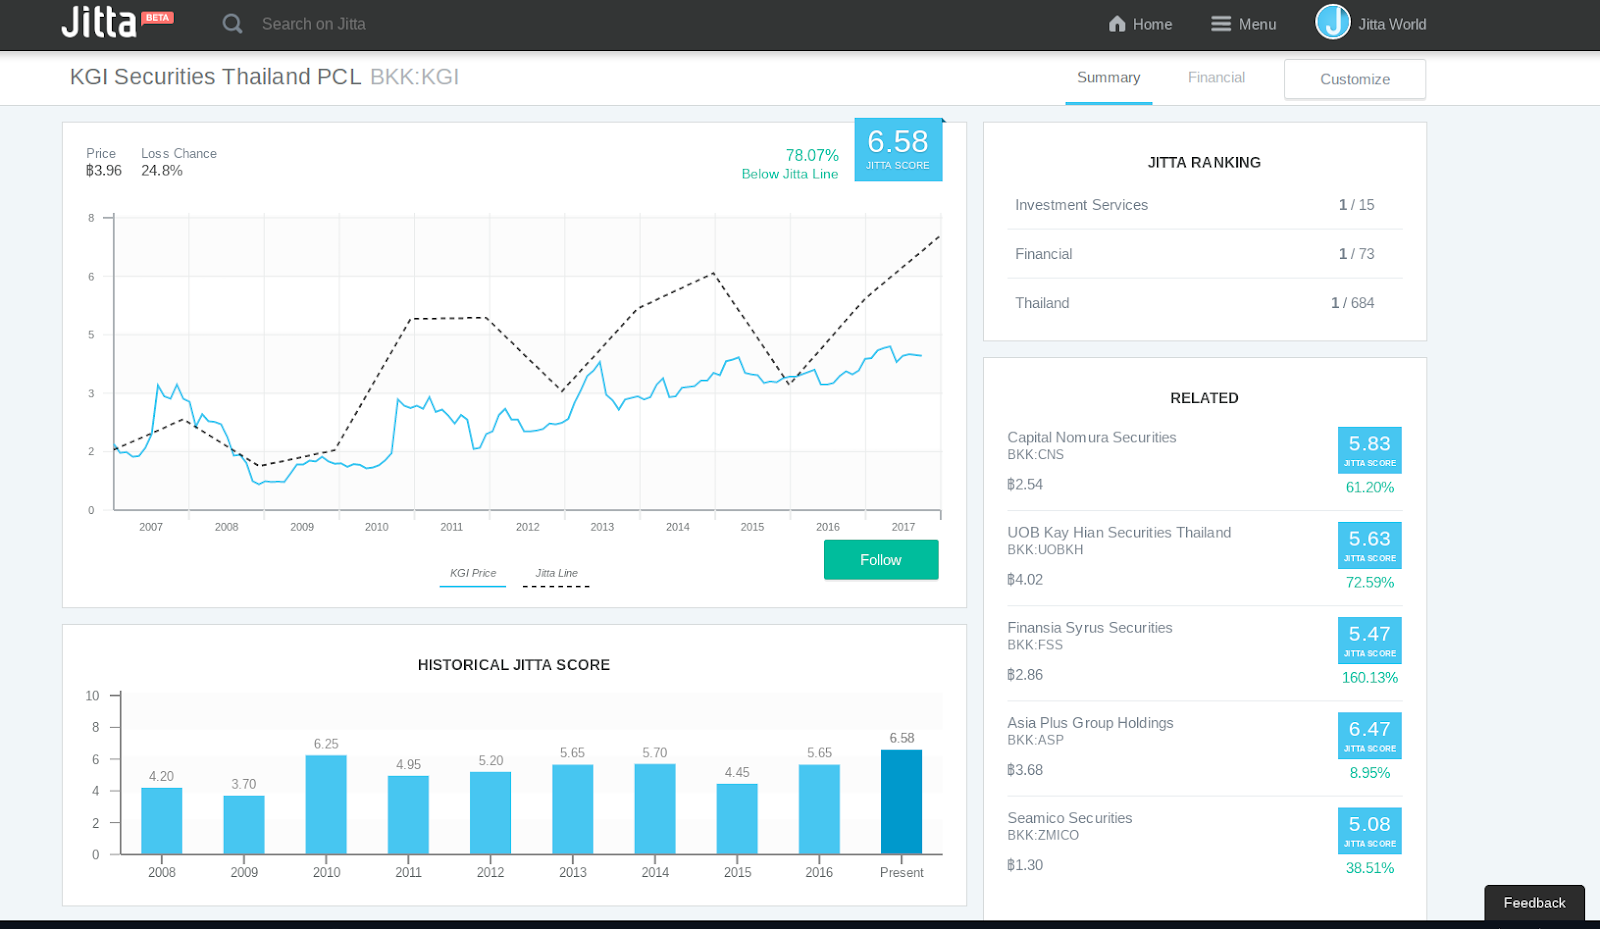
Get a quick overview of any stocks with this widget. You can look back over the past ten years and see trends in Jitta Score, Jitta Line and stock price. Also on display are a Loss Chance and a percentage indicating how expensive or cheap the stock is compared to Jitta Line.
1. Click on interested stock to see the summary of stock that include or its financial data.
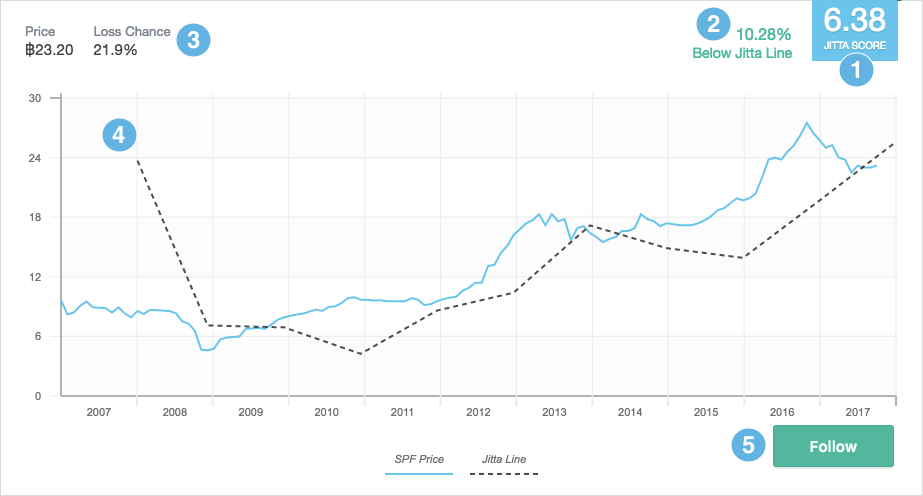
2. STOCK SUMMARY include as follows:
- Jitta Score is a rating from 0 to 10 of company’s business performance which 10 is a company with very good business performance.
- Below/Above Jitta Line will tell you that the stock is trading above or below its intrinsic value.
- Current price and Loss Chance (it should be below than 40%)
- This graph compare between market price of stock and Jitta Line within past 10 years.
- You can click on ‘Follow’ button to update an information of that stock.
Now, take a look at our simple chart containing visual representations of Jitta Line (dash line), the stock price (blue line) and the volume. After pressing on the graph, Jitta Score will change every month with its business performance.
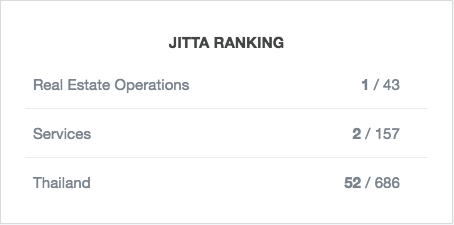
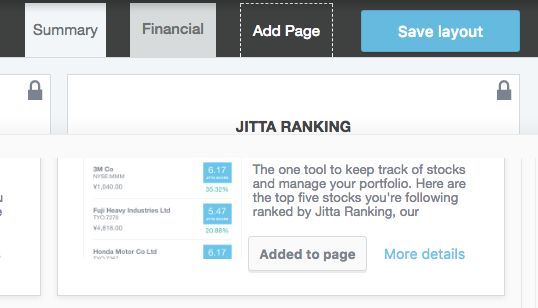
3. JITTA RANKING: This widget shows you where your favorite stock is on Jitta Ranking—a system that arranges every stock in a particular country in order of its investment potential. The ranking is determined largely by Jitta Score, Jitta Line and recent business performance. You can view the ranking by sector, industry and country.

4. HISTORICAL JITTA SCORE: Find out how well and consistent a company’s business performance has been throughout the past ten years based on Jitta Score. High scores are undoubtedly better, but don’t forget to look for consistency as well.
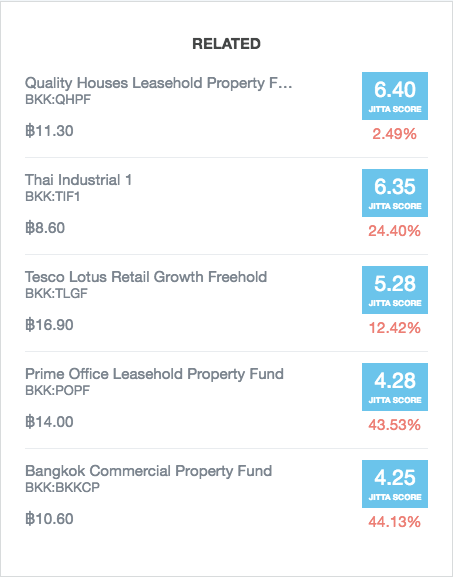
5. RELATED STOCKS: Find out which other companies are competing with the business you’re interested in. This widget shows you stocks with a similar business to the one you’re looking at, as well as stocks within the same sector and industry for you to explore. Who knows, they could make a better investment!
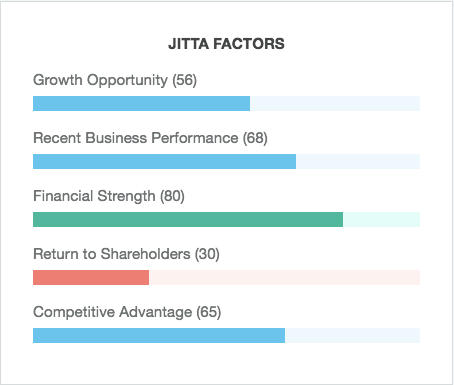
6. JITTA FACTORS: Here are the five important business attributes that make a company wonderful, graded and color-coded for you. Scores range from 0 to 100; the higher the score, the better. Only the numbers from the financial statements that are relevant to each Jitta Factor are used in the calculation.

7. JITTA SIGNS: Key business strengths and weaknesses, extracted from the financial statements and presented to you in an easy-to-understand format. Wonderful companies exhibit consistent strengths (green) and minimal weaknesses (red). When the numbers are nothing particularly negative or positive, Jitta Signs won’t be visible.

8. To look more deep detail of Jitta Signs, clicking on that sign would show a calculated number which relate to the sign.

9. JITTA ALERT: Be notified when it’s time to buy. You set your preferred market price here, and the system will send you a notification when the price of a followed stock hits the spot. This will help you focus on selecting great businesses and taking action when the time is right.

10. To set ‘JITTA ALERT’, clicking on ‘ENABLE’ and choosing the range of price (Below/Above Jitta Line by x%) will notify through email.
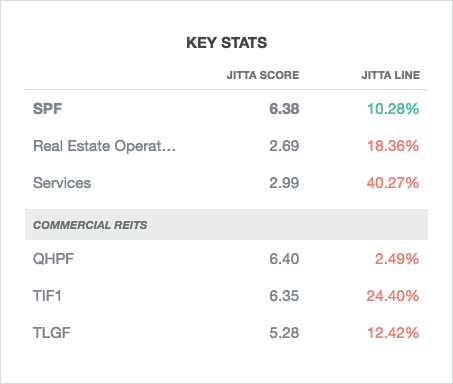
11. KEY STATS: Always invest in the cream of the crop. Our Key Stats helps you compare stocks within the same sector and industry. See if your favorite stock is doing better than the sector or industry average, and find out how overpriced or undervalued it currently is compared to its competitors.

12. COMPANY DESCRIPTION: All the important numbers to look out for in one place. We’ve pulled these statistics from the financial statements so you get an overview of the company’s fundamentals and its current standing in the stock market right away.

13. MY NOTE: Make notes of all important facts about a company here, and you can access all the information you’ve been researching in one place. Over time, you will have better understanding of the stocks you are investing in, and whatever decisions you need to make will come much easier.
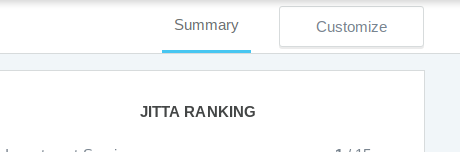
14. To adjust the template, click on ‘CUSTOMIZE’ on the top right corner.
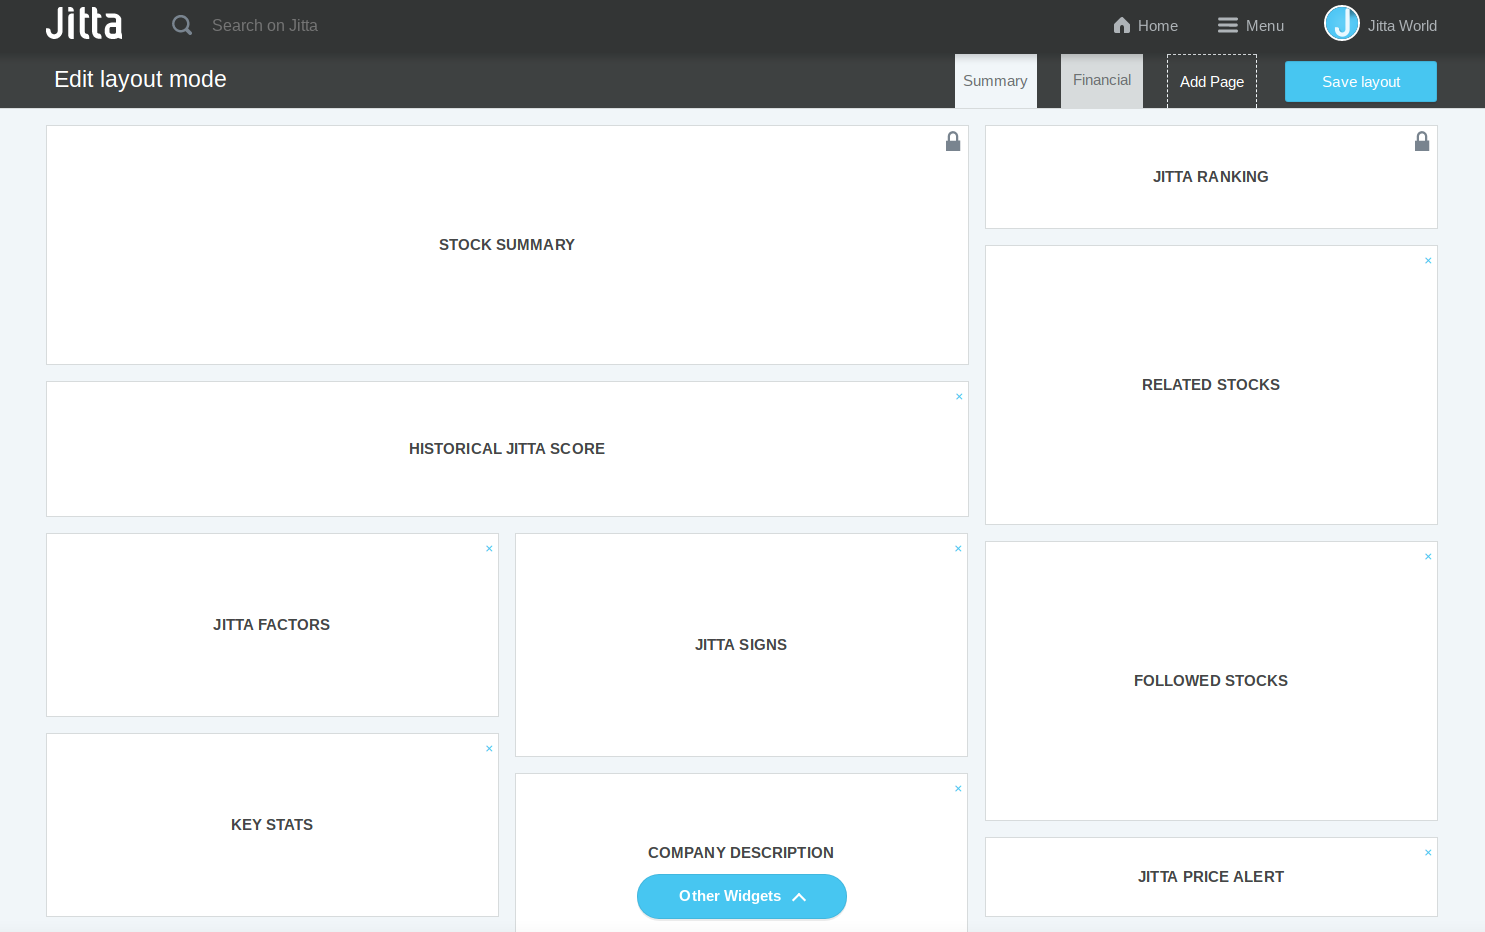
15. Now, you will find ‘OTHER WIDGETS’ at the bottom of the page.

16. You would find many more widgets to use as follows:
- Followed Stocks: The one tool to keep track of stocks and manage your portfolio. Here are the top five stocks you’re following ranked by Jitta Ranking, our algorithm that arranges stocks in order of their investment potential. When you know which stocks are worth investing in the most, you can adjust your portfolio accordingly.
- Tag: Organize stocks based on your own categories to save time and simplify your investing processes. The more time you can save with these little things, the more comprehensively you can analyze each stock.
- Volume Changes: If you want to know how much of a given stock has been traded on the stock market and how it has changed from day to day, this is the widget you need. The data is updated daily at the end of every trading day.
- Analyst Estimates: When past performance isn’t enough for you to decide which company to invest in, this widget tells you what lies in store for a particular company, based on a professional analysis by Thomson Reuters. The information is updated daily.
- Company Snapshot: All the important numbers to look out for in one place. We’ve pulled these statistics from the financial statements so you get an overview of the company’s fundamentals and its current standing in the stock market right away.
- Management: Know who’s running the business you’re investing in. This widget shows you who are on the management team and are the driving force behind your favorite company.
- Market Statistics: In order to gain a clear picture of how well a certain business is performing on the stock market, you need to look to broad indices as benchmarks. This widget allows you to do the comparison in one glance by showing the changes in the index value and the stock price side by side.
- Valuation Measures: How much should you pay for that stock? There are a multitude of valuation measures that can point you to the most definite answer. We pulled those various indicators from the financial statements and string them together into one useful widget. Because, why not consider them all?
- Support Center: Have questions about Jitta’s methodology or usage of the website? Consult our FAQs here. Type in what you want to learn more about and the widget will come up with relevant topics you could explore, from the meaning of Loss Chance to how to invest small amounts and still reach your goals.
- Revenue: Annual and quarterly look at a company’s revenues generated in the last five years (or five quarters).
- Net Profit: Annual and quarterly look at a company’s net profits generated in the last five years (or five quarters).
- Net Profit Margin: Annual and quarterly look at a company’s net profit margins generated in the last five years (or five quarters).

17. You can look at ‘more details’ of each widget and click on ‘ add to page’ to add into Stock summary page.
18. Click on ‘Save layout’ on the top right corner to update your own summary page.

19. If you want to delete a widget, click X on the top right of the box.

20. If you want to move/adjust a widget, just move the box to wherever you want then click ‘Save Layout’.
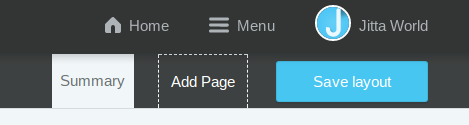
21. Furthermore, click ‘Customize’ then ‘Add page’ if you want to add more tab.
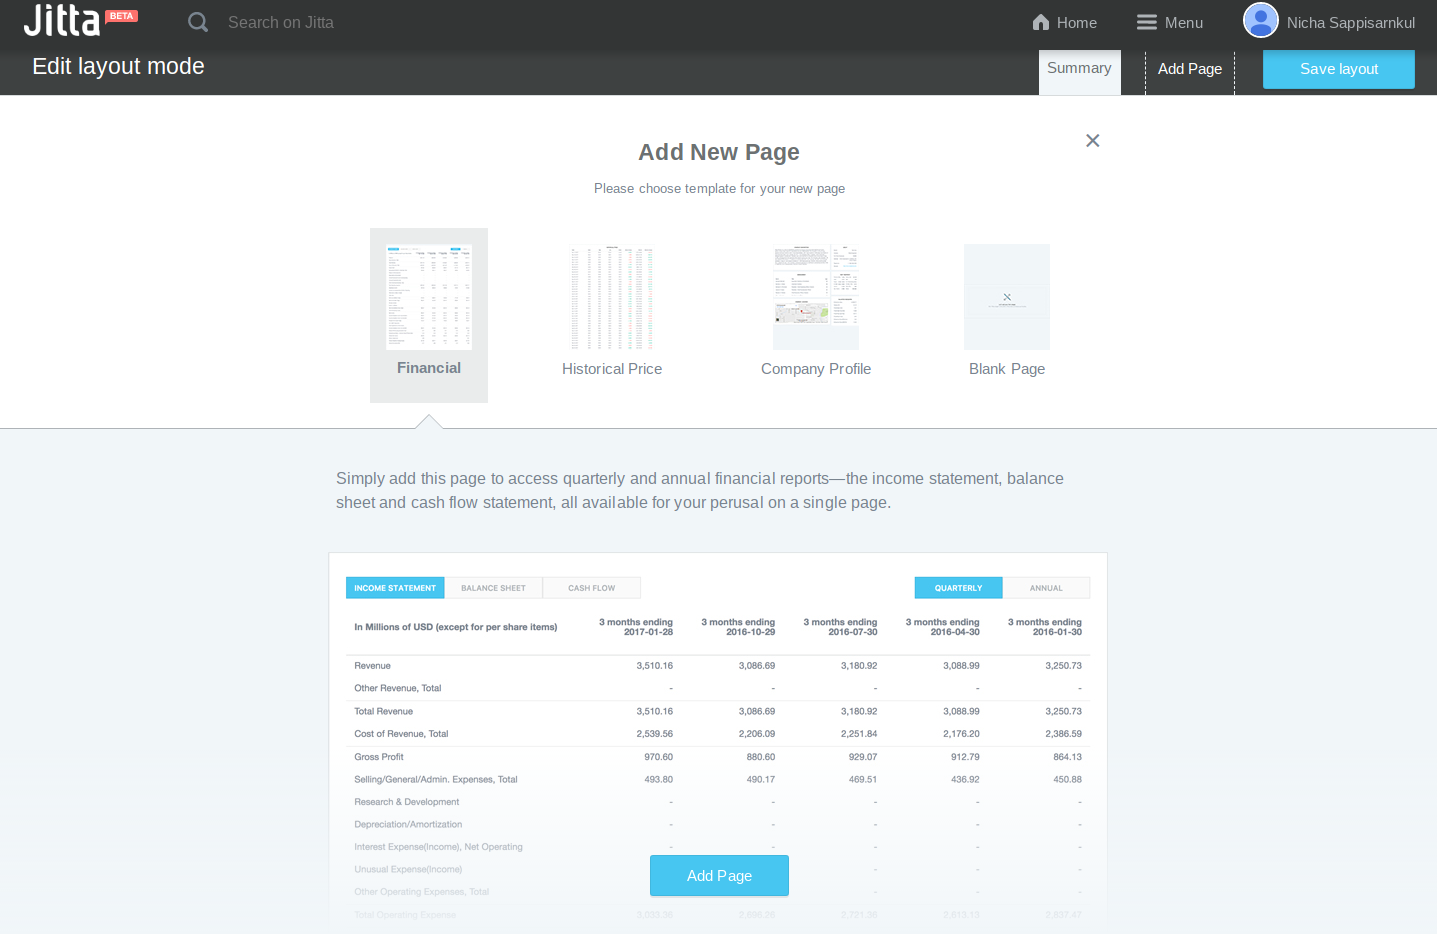
22. There are 4 types of page for you to choose as follows:
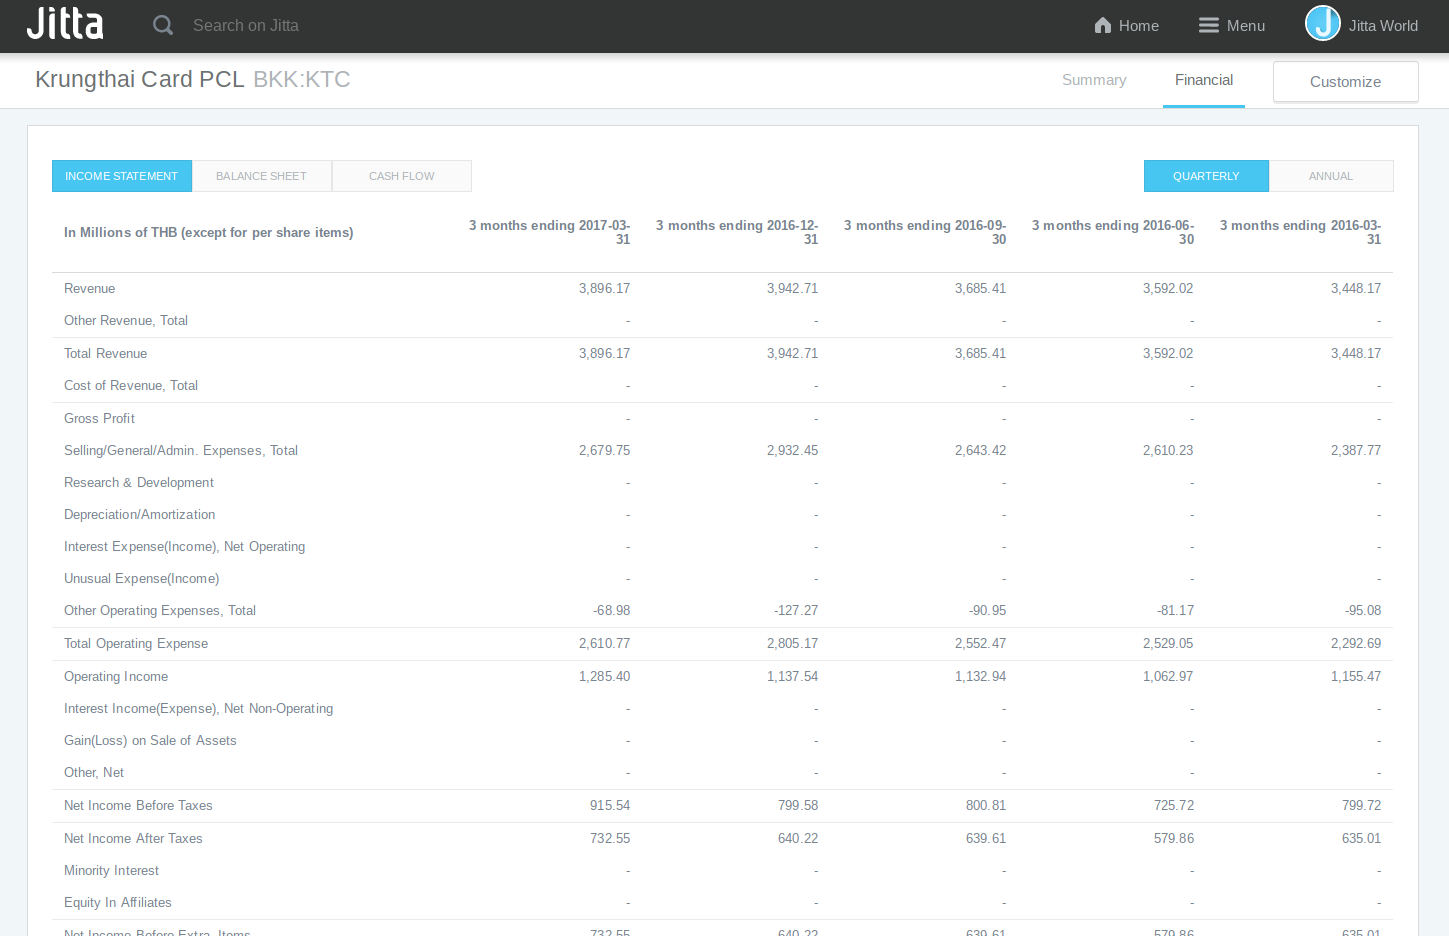
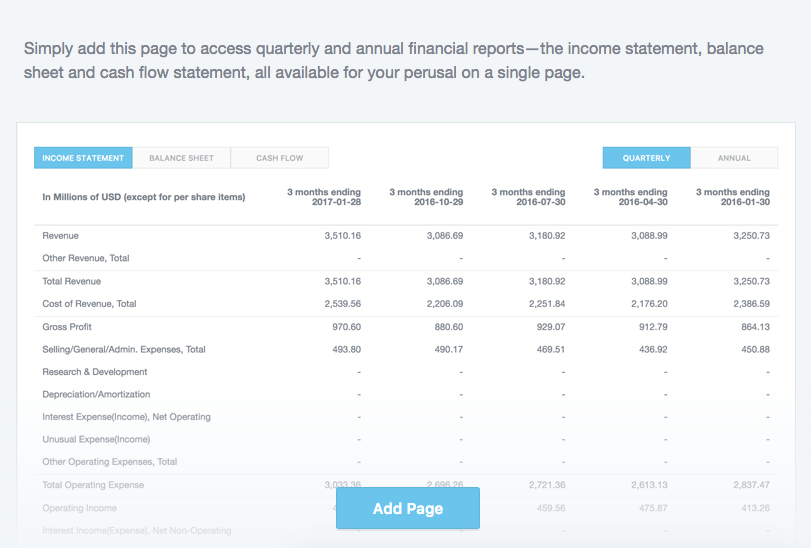
- FINANCIAL: Simply add this page to access quarterly and annual financial reports—the income statement, balance sheet and cash flow statement, all available for your perusal on a single page.
- HISTORICAL DATA: Make sure you’re on the right side of the trade with this page. Changes in stock prices and trading volumes within the past 120 days are displayed to help you spot a signal of upward or downward momentum before anyone else!
- COMPANY PROFILE: Here’s a quick way to learn more about each company. The Profile page contains a company description, a list of its management team members, a brief overview of its business and performance, and its estimated value.
- BLANK PAGE: For the indie investor with a system of your own, this is an empty canvas on which you can arrange widgets in any orders that satisfy your thirst for information.
23. Add page that you want.
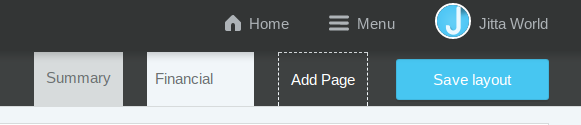
24. Click on ‘Save Layout’, then that page will appear on the right side of summary page.
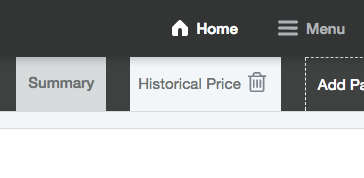
25. If you want to delete the tab, click on bin icon to remove the page then ‘Save Layout’ again.