More concept, ideas and investment strategies with Jitta
# 3 : Tracking your Results
In this article, we will discuss something very simple, yet overlooked by many, and is actually a very important process in any work setting, including in investing: tracking your results.
I have come across this statement ever since I started working: “You cannot improve what you can’t measure.” If you continue to invest without measuring your results… you never know how much returns you generate, whether it meets your target or not, and how you will improve, then you will be like a toy ship that speeds around in circles in the same pool.
As mentioned in Jitta Portfolio Series # 1, looking only at your Total Gains without considering the time frame of investment does not reflect much of anything. Looking at yearly returns will allow us to see a clearer picture of the result; and if you’re serious in creating future wealth, then you should look at the yearly stats from many years (including compounded returns each year) and compare them with your own target.
This is why Jitta Portfolio has the Statistic page, which combines your returns in the long-run including other important stats that you can use to help improve your investment decisions.
1. Measuring your returns compared to the main index (i.e. SET 50)
Since investing in the stock index in the long-run generates better return than the inflation rate, or buying bonds, therefore, when if we’re going to invest by ourselves, we should beat the index’s return at the very least (If we lose to it, then we should stop investing by ourselves and just purchase index funds).
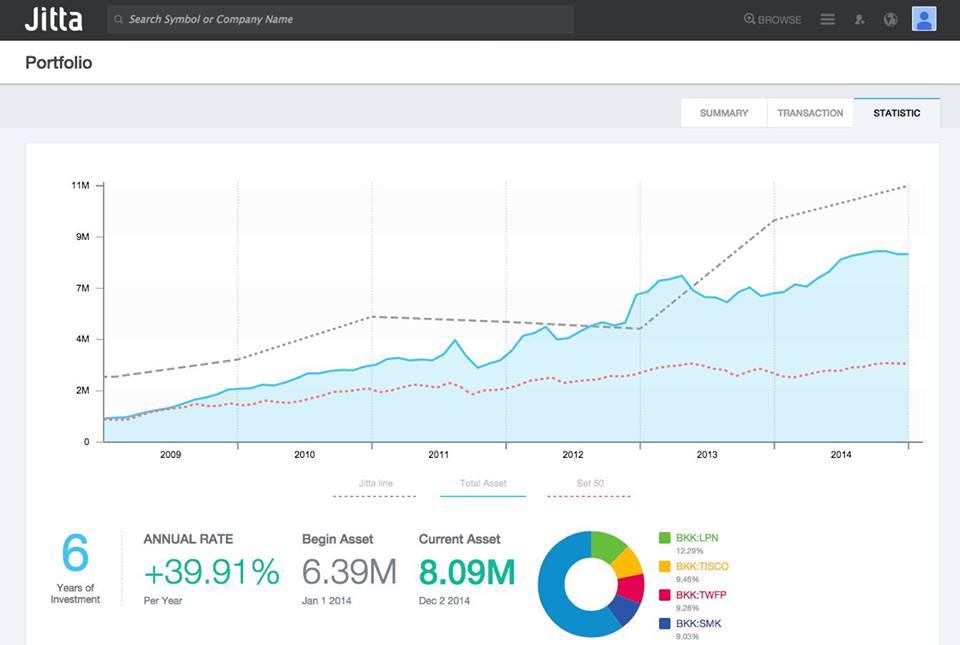
The Jitta Portfolio displays a graph of your port’s growth in each year since you first started investing (or when you first started keying data into Jitta) and will compare the results to the growth of SET 50 (or basically, your growth if you purchase, on average, every stock in SET 50)
From the example, you will see that since 2009, if we invested in the SET 50 port, we will have about a 3.3% growth. One million baht becomes 3.3 million baht. Whereas if we invested in Jitta’s Top 5, Top 10 (as shown in the example), our port would have grown 7.4%. One million Baht becomes 7.4 million baht. This is more than double of SET 50‘s return.
For better results, apart from looking at the long-term graph of our returns compared to SET 50, we should also look at the chart of returns per year, whether our returns beat the market every year or not. If you beat it every year then good for you, but if some years you lose to the market, then you should figure out why, where was your mistake, and why did you lose profit?
If you continue to track, you will see the errors in your investment, which will allow you to improve in the future.
2. Examine your port’s growth and compare it to the Jitta Line
Like I said, in order to have a happy and worry-free investment, when you start investing, try not to be too fixated on individual stocks in the port. Try to look at the big picture, and then figure out the mistakes or abnormality in the port as you go along.
This is the reason Jitta Portfolio allows you to compare your port’s growth with the Jitta Line, and see whether presently the port’s net book value (according to market price) is higher or lower than the true vavlue of the port (assessed from a business point of view).
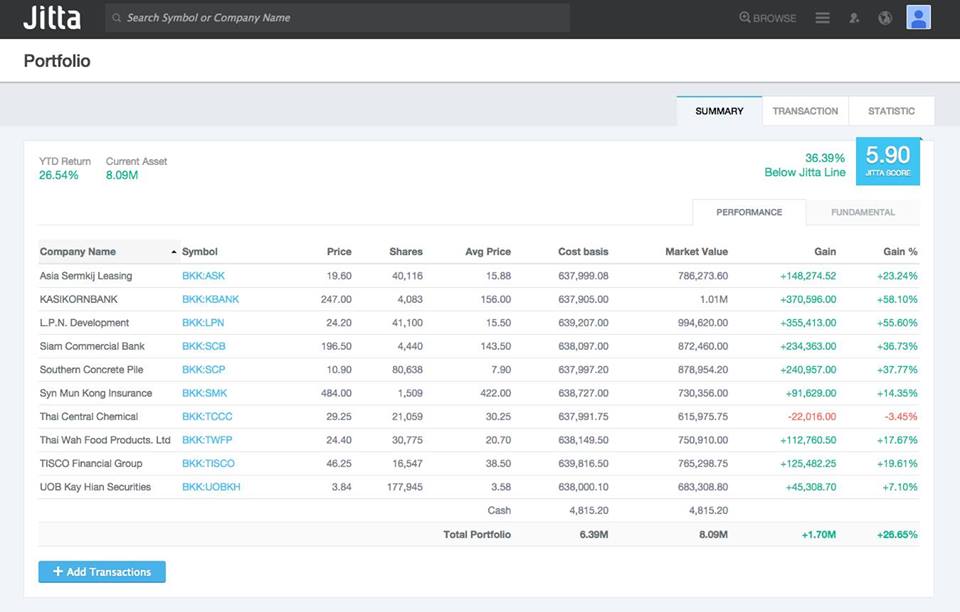
This enables us to view our Portfolio the way we would view a business, because there’s both the Jitta Score and Jitta Line, and we’re about to clearly see whether the price is higher or lower than the Jitta Line, and how much; hence allowing us to see abnormalities in our port, and then use the other tools in Jitta Portfolio to readjust and improve it.
OF course, if we try to adjust the port so that we have high Jitta Scores and a rising Jitta Line, our net book value will continue to grow undoubtedly.
3. Give importance to the compounded return rate
In the world of investment, the compounded return rate is extremely important, and we should constantly evaluate how much compounded return we are able to generate, and whether it is more or less than our target.
Generally when investing in the long-run for tens of years, the compounded return rate for most investors will be no more than 20% per year. So we should set our yearly target around this percentage, to avoid stressing out too much, because even the world-class investors get around this rate of return.
On Jitta Portfolio’s Statistic page, you will clearly see the amount you invested and the compounded return. However, if you want further details per year, you can scroll down to see the returns chart. From the example, you will see that our compounded rate of return is at 39.71% per year, while SET50’s is at 22.15% per year, meaning we beat SET 50 and our target at 20% per year. This is a great sign. But if one day, our return starts to decrease, we may need to spot errors and improve our port.
That said, one mistake that people tend to forget, which alters the real return amount is the result from transacting cash in and out of the portfolio.
For example, in 2009, if we start investing with 1 million Baht, and managed to generate incremental profits up until 2013, where our port has grown to 2 million Baht, and in 2014, we inject more cash into the port to buy 6 million Baht worth of stocks, we calculate: our initial investment of 1 million baht, invested for 6 years becomes 8 million Baht; our compounded return rate is at 41.42% per year… is immediately wrong! (Because we increased our own capital of 6 million Baht during the last year, and so it doesn’t count. This is not the money that grew from our investments, but from our own injection of cash.
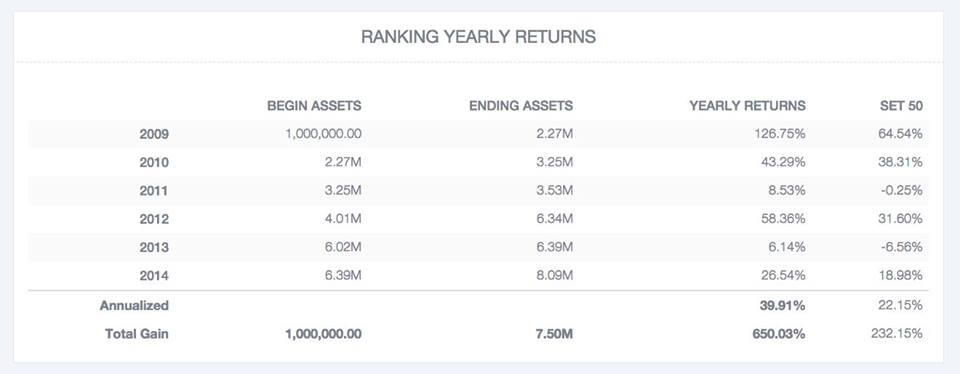
So now let’s look at it more carefully. In the returns chart, we will see that our port grew from 1 million Baht from 2006 to 8.02 million Baht in 2014, which is a 41.48% compounded growth, but tif we examine more carefully, we will see that in 2012, there was an injection of cash (Assets at the beginning of 202 is more than assets in 2011) and in 2013, there’s been a withdrawal of money from the port (Assets at the beginning of 2013 is lower than Assets at the end of 2012). We have to factor this in, as to not skew the results from drawing cash in and out of the port to affect the return figure.
Once we are able to remove the influence of cash in/out of the port, we will find that the port grows to 7.44 million Baht in the latest year (as shown in the Total Gain at the bottm as Ending Assets). This is not the 8.02 milion Baht value, making the correct compounded return rate 39.71 per year, not 41.48% per year as we calculated earlier.
Therefore, if you were to record our data in Jitta Portfolio, you can be confident that the information and figures including the returns from investment, are correct. So you can easily evaluate how you’re doing accurately.
4. Study the investment strategies that create profit and ones that create losses.
This is another interesting topic, and is something that many investors are still missing. Some have been investing for many years, but they have no idea why they are making profit or why they are losing money. This is because they do not have clear strategies in investmen, and never record stocks that make you profit/loss and why -so they have no information to help improve their investment.
Jitta Portfolio can help you with that (to be continued)
P.s. For those of you who haven’t ready Jitta Portfolio Series 1, 2, and 4, please visit the following links to view them:
Jitta Portfolio Series # 1 : Portfolio Management
http://library.jitta.com/en/article/jitta-portfolio-series-1-portfolio-management
Jitta Portfolio Series # 2 : Asset Allocation
https://library.jitta.com/en/article/jitta-portfolio-series-2-asset-allocation
Jitta Portfolio Series # 4 : Learning from your past investments
https://library.jitta.com/en/article/jitta-portfolio-series-4-learning-from-your-past-investments
P.p.s. Those who haven’t checked out Jitta Portfolio can do so at: http://www.jitta.com/portfolio